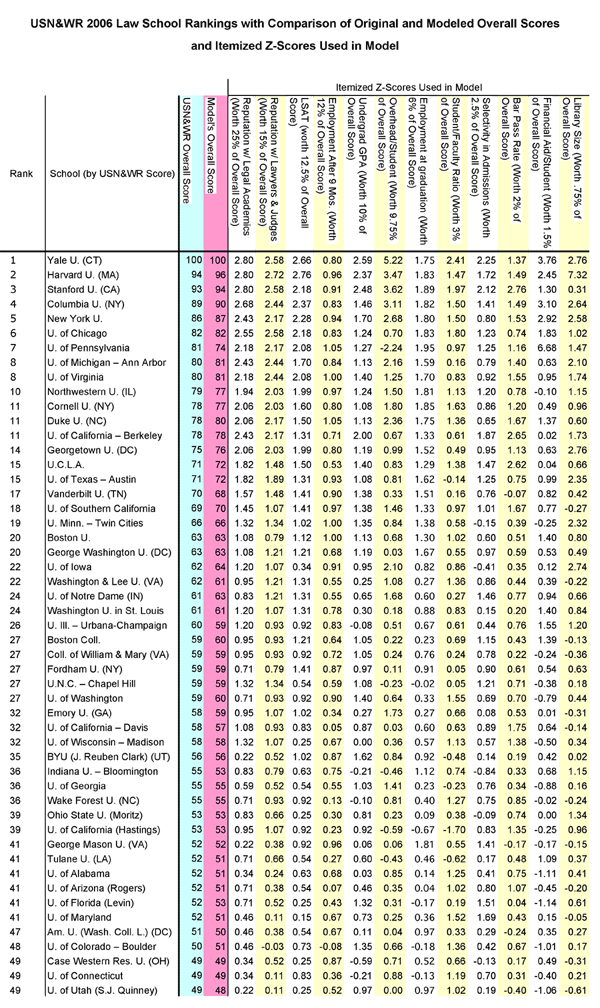
What's a "z-score"? The geek in me thought you would never ask! It provides a way to standardize a group of measurements made on different scales (such as measurements of law schools' LSATs, GPAs, etc.) so that those measurements can be compared and combined into one score (such as in the overall scores reported above). You generate a z-score for one in a set of measurements by subtracting the mean of the set from the measurement in question and dividing that amount by the standard deviation of the set.
(With all due respect to those of you eager to prove your geek bona fides, allow me to note that I realize some people reserve "z-score" for a different statistical tool. I don't think, however, that I've deviated from the standard usage. Har har.)
[NB: Please note that I've edited the above chart in response to comments from Prof. Douglas Sylvester, for which I thank him.]
9 comments:
Woo-hoo! My school's on it and my DH's is not! I'm better than him even if he's Order of the Coif. Just a joke, really, I'm at-home now and I need something to make me feel superior.
Yeah, I didn't read the statistical stuff...to me the "z" stands for "zzzzzzz......"
Your list is much more accurate than US News and the Law School 100. Thanks. Columbia 2L
Why is Penn's Overhead/Student score the lowest on the list by about two standard deviations?
-2.24 for student/overhead costs? Are we really supposed to believe that out of the entire top 50 Penn spends the least in that area by several standard deviations? Come on.
I used your data to try to replicate your results, and I appear to be unable to do so.
Can you explain EXACTLY how it works? I calculated weighted averages of the z-scores of the schools (weighted by the percentages in the column headers), and then I divided each school's weighted average by Yale's weighted average to get a percentage. But I get the following scores:
Harvard: 93.72
Stanford: 90.15
Columbia: 82.02, etc.
which does not match your result.
Would you mind posting the spreadsheet for download? Failing that, would you correct my calculations?
Anonymous, I too would like to know the exact method. I tried your method and came up with nonsensical results for NYU.
-quasar
Also, from comparing Penn vs. Duke/Northwestern on this chart, Penn is greater in every category except two:
1. The aforementioned overhead/student worth [9.75%] where Penn has the lowest score by far on the entire chart.
2. The student/faculty [3%] where the difference appears to be insignificant.
So what I'm wondering is, can Penn's overhead/student numbers be *that* bad?
-quasar
Those of you who wondered about Penn's low "expenditures/student" number might want to check out my response to similar questions in my prior post on this topic. Here, I will simply say that the number accurately reflects the expenditures that Penn reported to the ABA (but probably not to USN&WR), and the they were so low because of the unusual way that Penn characterized its expenditures (it characterized them so as to qualify an unusually low amount under "expenditures/student" and an unusually high amount under "financial aid/student). Overall, Penn reported expenditures roughly equal to those of comparably ranked schools. It just characterized its expenditures differently--and, notably, in a way that hurt it under USN&WR's formula.
Those of you who wanted the formula: You cannot get an accurate result without all the data. You might, however, try something like this:
model's overall score=((97.5/(2.53-1.81)*((school's raw and weighted score-1.81))+2.5
I don't feel at liberty to release the spreadsheet containing all the data, as it included propriety and confidential information.
Anybody know where I can find updated rankings?
Post a Comment