In earlier posts I described my model of the most recent U.S. News & World Report law school rankings (the "2010 Rankings"), quantified its accuracy, and published itemized z-scores for the top two tiers of schools. (Separately, I also suggested some reforms that might improve the rankings.) Studying those z-scores reveals a great deal about how the top-ranked law schools got that way. The lessons hardly jump out from the table of numbers, though, so allow me to here offer some illustrative graphs.

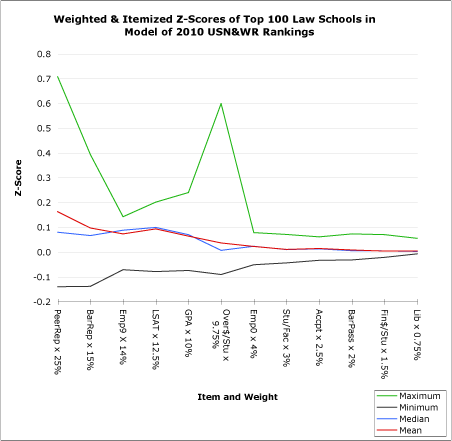
The above graph, "Weighted & Itemized Z-Scores of Top 100 Law Schools in Model of 2010 USN&WR Rankings," reveals an interesting phenomenon. The items on the left of the graph count for more of each school's overall score, whereas the items on right count for less. We would thus expect the line tracing the maximum weighted z-scores for each item to drop from a high, at PeerRep (a measure of a school's reputation, worth 25% of its overall score), to a low, at Lib (a measure of library volumes and equivalents, worth only .75%). Instead, however, the maximum line droops at Emp9 (employment nine months after graduation) and soars at Over$/Stu (overhead expenditures per student). The next graph helps to explain that mystery.

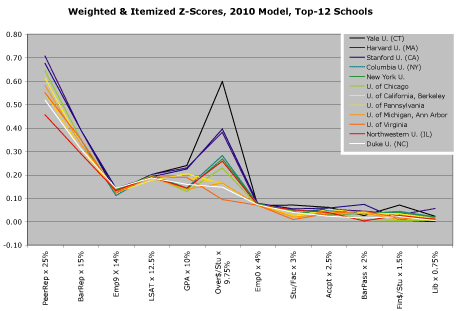
The above graph, "Weighted & Itemized Z-Scores, 2010 Model, Top-12 Schools," reveals two notable phenomena. First, the Emp9 z-scores, despite potentially counting for 14% of each school's overall score, lie so close together that they do little to distinguish one school from another. In practice, then, the Emp9 factor does not really affect 14% of these law schools' overall scores in the USN&WR rankings. (Much the same holds true of top schools outside of these 12, too.)
Second, the Over$/Stu z-scores range quite widely, with Yale having more than double the score of all but two schools, Harvard and Stanford, which themselves manage less than two-thirds Yale's Over$/Stu score. That wide spread gives the Over$/Stu score an especially powerful influence on Yale's overall score, making it almost as important as Yale's PeerRep score and much more important than any of the school's remaining 10 z-scores. In effect, Yale's extraordinary expenditures per student buy it a tenured slot at number one. (I observed a similar effect in last year's rankings.)
Other interesting patterns appear in "Weighted & Itemized Z-Scores, 2010 Model, Top-12 Schools." Note, for instance, that Virginia manages to remain in the top-12 despite an unusually low Over$/Stu score. The school's strong performance in other areas makes up the difference. Though it is not easy to discern from the graph, Virginia's reputation and GPA scores fall in the middle of these top-12 schools' scores. Northwestern offers something of a mirror image on that count, as it remains close to the bottom of the top-12 despite a disproportionately strong Over$/Stu score. The school's comparatively low PeerRep and BarRep scores (the lowest of those in the top-12) and GPA (nearly tied for the lowest) score pull it down; Northwestern's Over$/Stu score saves it.
[Since I find I'm running on a bit, I'll offer some other graphs and commentary in a later post or posts.]
[Crossposted at Agoraphilia, MoneyLaw.]
No comments:
Post a Comment