A government that enjoys a natural monopoly on satisfying the express demand for its services will have the power, and incentive, to expand to meet non-express demand. The result: a supply of more government services, at a higher price, than citizens in fact want. In an extreme case, satisfying the implied or hypothetical demand for government services may result in an oversupply so gross that consumers expressly assign it a negative price. In other words, consumers of government services may actually object to what they supposedlywant.
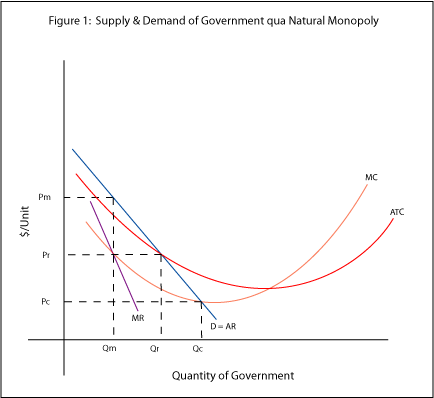
Government represents a sort of service industry, albeit one marked by some peculiar features. For one thing, governments can often lay plausible claim to qualifying as natural monopolies. (Perhaps that is not so peculiar; David Friedman convincingly argues that natural monopolies pervade sufficiently small markets.) Figure 1, below, offers a fairly conventional graph of the economic features of government qua natural monopoly.

(In figure 1, "MC" stands for "marginal costs of production"; "ATC" for "average total costs of production"; and "D" for "aggregate demand." Because we here portray a monopoly aggregate demand equates to "AR," or "average revenue." The various uses of "P" mark prices; "Q" of quantities. The lowercase "m," as in "Pm," designates the monopoly price. "Qm" of course corresponds to the monopoly quantity. In like fashion, "r" designates the regulated price and quantity, and "c" the competitive ones.)
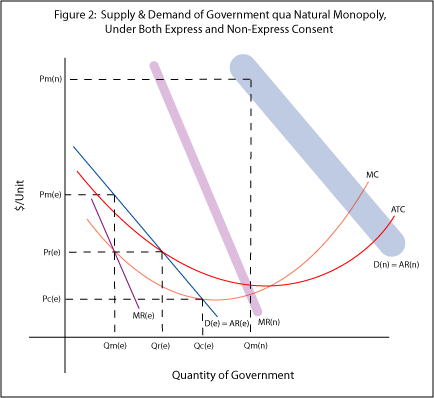
So it goes, at least, in the standard economic view, which concerns only expressly consensual transactions. But as I noted earlier,, we might do well to also consider transactions marked by less than express consent. Government monopolies, for instance, typically claim to respond to implied and hypothetical consent. What does a market based on non-express consent look like? Figure 2, below, illustrates.

Figure 2 shows the non-express demand, marginal revenue, monopoly price, and monopoly supply of government services. All those non-express measures come marked with "(n)" suffixes. The express measures from figure 1 remain, but now carry "(e)" suffixes to distinguish them from the newly added material. (For the sake of clarity, I've dropped from figure 2 some of the information offered in figure 1.)
Figure 2 illustrates three interesting results. First, non-express demand, because it includes transactions beyond those expressly agreed to, traces a curve to the right of typical (i.e., express) demand. Second, due to its speculative nature, non-express demand of necessity charts a somewhat more fuzzy line than express demand does. Figure 2 thus draws the non-express demand and marginal revenue curves as relatively imprecise blobs.
Third, and most crucially, figure 2 illustrates that a government monopoly meeting non-express demand may provide more services, at a higher price, than consumers in fact demand. How can government agents get away with thereby supplying and getting paid for grossly inefficient level of services? Recall that we charitably but reasonably supposed that in a market based on expressly consensual transactions, government will enjoy a natural monopoly. Government agents can thereby lay claim to a monopoly on the initiation of coercion. They can all too easily wield that power to expand their market share, claiming a mandate to satisfy implied or hypothetical consent. And, given the super-monopoly profits thereby afforded, they have powerful incentives to do so.
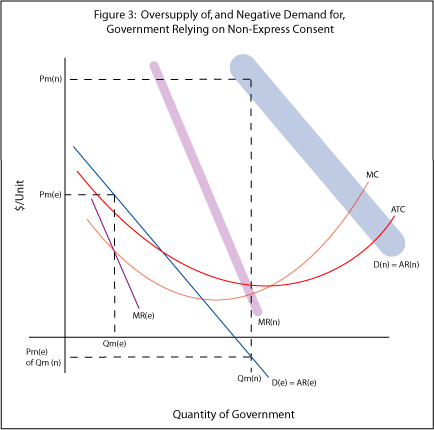
Figure 2 only hints at something that figure 3, below, makes explicit: Government based on non-express consent may supply—"oversupply," really—a level of service that consumers expressly value at less than zero. That result follows quite directly from the simple, if somewhat unusual, expedient of following the express demand curve even as it plunges below the x-axis. Economists do not generally explore that region of "negative demand," granted, but they seldom have reason to do so. Figure 3, because it tracks both express and non-express transactions, gives us good reason to spell out what happens when a supposedly justified supply meets actual consumer demand.

What, in sum, does this application of "consent theory" (as I style it) teach? Government services, because they have power and incentives to expand from natural monopolies based on express consent to coercive monopolies based on implied or hypothetical consent, threaten to provide more government than consumers really want. In some cases, consumers may afford negative value to the resulting oversupply of government services. We thus might say that figure 3 illustrates, in the iconography of economics, the causes and effects of tyranny.
That paints a rather grim—but, I would argue, accurate—picture of how government can grow from a natural monopoly into an artificial, and unwelcome, one. Note, however, that I have not yet invoked the public goods justification for government power. I'll take that up my next post on consent theory, explaining why a government that aims to meet the hypothetical demand for public goods runs a reduced risk of supplying services to which that consumers assign negative value. In other words, governments based on the hypothetical demand for public goods tend to become bloated but not monstrous.
[NB: I edited this post, some weeks after originally publishing it, to have it speak not specifically of hypothetical consent, but rather more generally of non-express consent. The latter comprises both implied consent and hypothetical consent.]
No comments:
Post a Comment